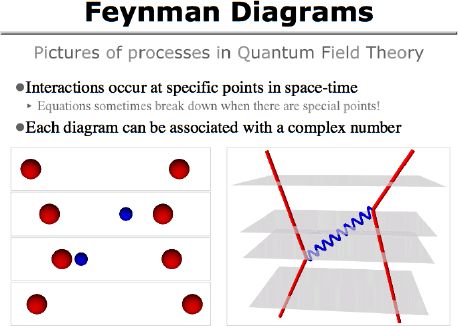
As usual, the images on the left are snapshots of the particles at different times. Those times correspond to the grey slices in the space-time diagram on the right.
You can see the specific interaction points in the space-time diagram, where the blue particle is emitted and then absorbed by the red particles. Those points will be important later, as we compare this to the situation in string theory.
I can't take the time here to explain how you calculate the complex number associated with each diagram; that's where a big part of the mathematical content of the theory comes from. But once you have the number, it behaves a bit like a wave function. (Specifically, you can take "superpositions" of the situations in various diagrams by adding up their numbers.)
The actual mathematical content of the theory has two parts. One, as mentioned above, is the calculation of the complex number for each diagram. And the other is the set of rules that determine what diagrams are allowed...
Up to my research page.
Up to my professional page.
My personal site is also available.
Any questions or comments? Write to me: jensens@alma.edu
Copyright © 2004 by Steuard Jensen.